

Dashboard Overview
Seerflow ships with a React dashboard served from the same FastAPI process that runs the ingest pipeline. There is no second uvicorn, no separate frontend deploy — seerflow start boots receivers, detection, correlation, and the dashboard all on one port.
Surfaces
Section titled “Surfaces”| Surface | URL | Purpose |
|---|---|---|
| Dashboard UI | http://127.0.0.1:8080/ | Sidebar-navigated console — Overview, Alerts, Events, Entities, ATT&CK, Sigma |
| REST API | http://127.0.0.1:8080/api/v1/ | Programmatic access — see REST API |
| WebSocket | ws://127.0.0.1:8080/api/v1/ws | Live event + alert stream — see WebSocket |
| Health probe | http://127.0.0.1:8080/api/v1/health | Liveness + dependency status |
The port is controlled by dashboard_port in seerflow.yaml (default 8080).
Navigation
Section titled “Navigation”The dashboard is a single-page app with a persistent left sidebar and a top bar. The sidebar groups screens into three sections:
| Section | Screens |
|---|---|
| Monitor | Overview · Alerts · Events |
| Investigate | Entities · ATT&CK · Hunt |
| Configure | Sigma rules · Receivers · Models · Settings |
The pipeline status (online indicator, uptime, events/sec) sits at the bottom of the sidebar. The top bar carries the breadcrumb, a command search (⌘K), the active time window, the light/dark theme toggle, and the notifications bell.
A red Disconnected banner appears below the top bar whenever the WebSocket drops.
Hunt, Receivers, Models, and Settings are placeholder screens in the current release.
Overview
Section titled “Overview”The landing screen is a two-column roll-up of pipeline health:
- KPI strip — events/sec, active entities, open alerts, and mean ingest latency
- Event volume by severity — stacked info / warn / critical volume over the recent window
- Recent alerts — the latest alerts with severity, rule, entity, and risk score
- Top risk entities — risk-ranked entities for the last 24h
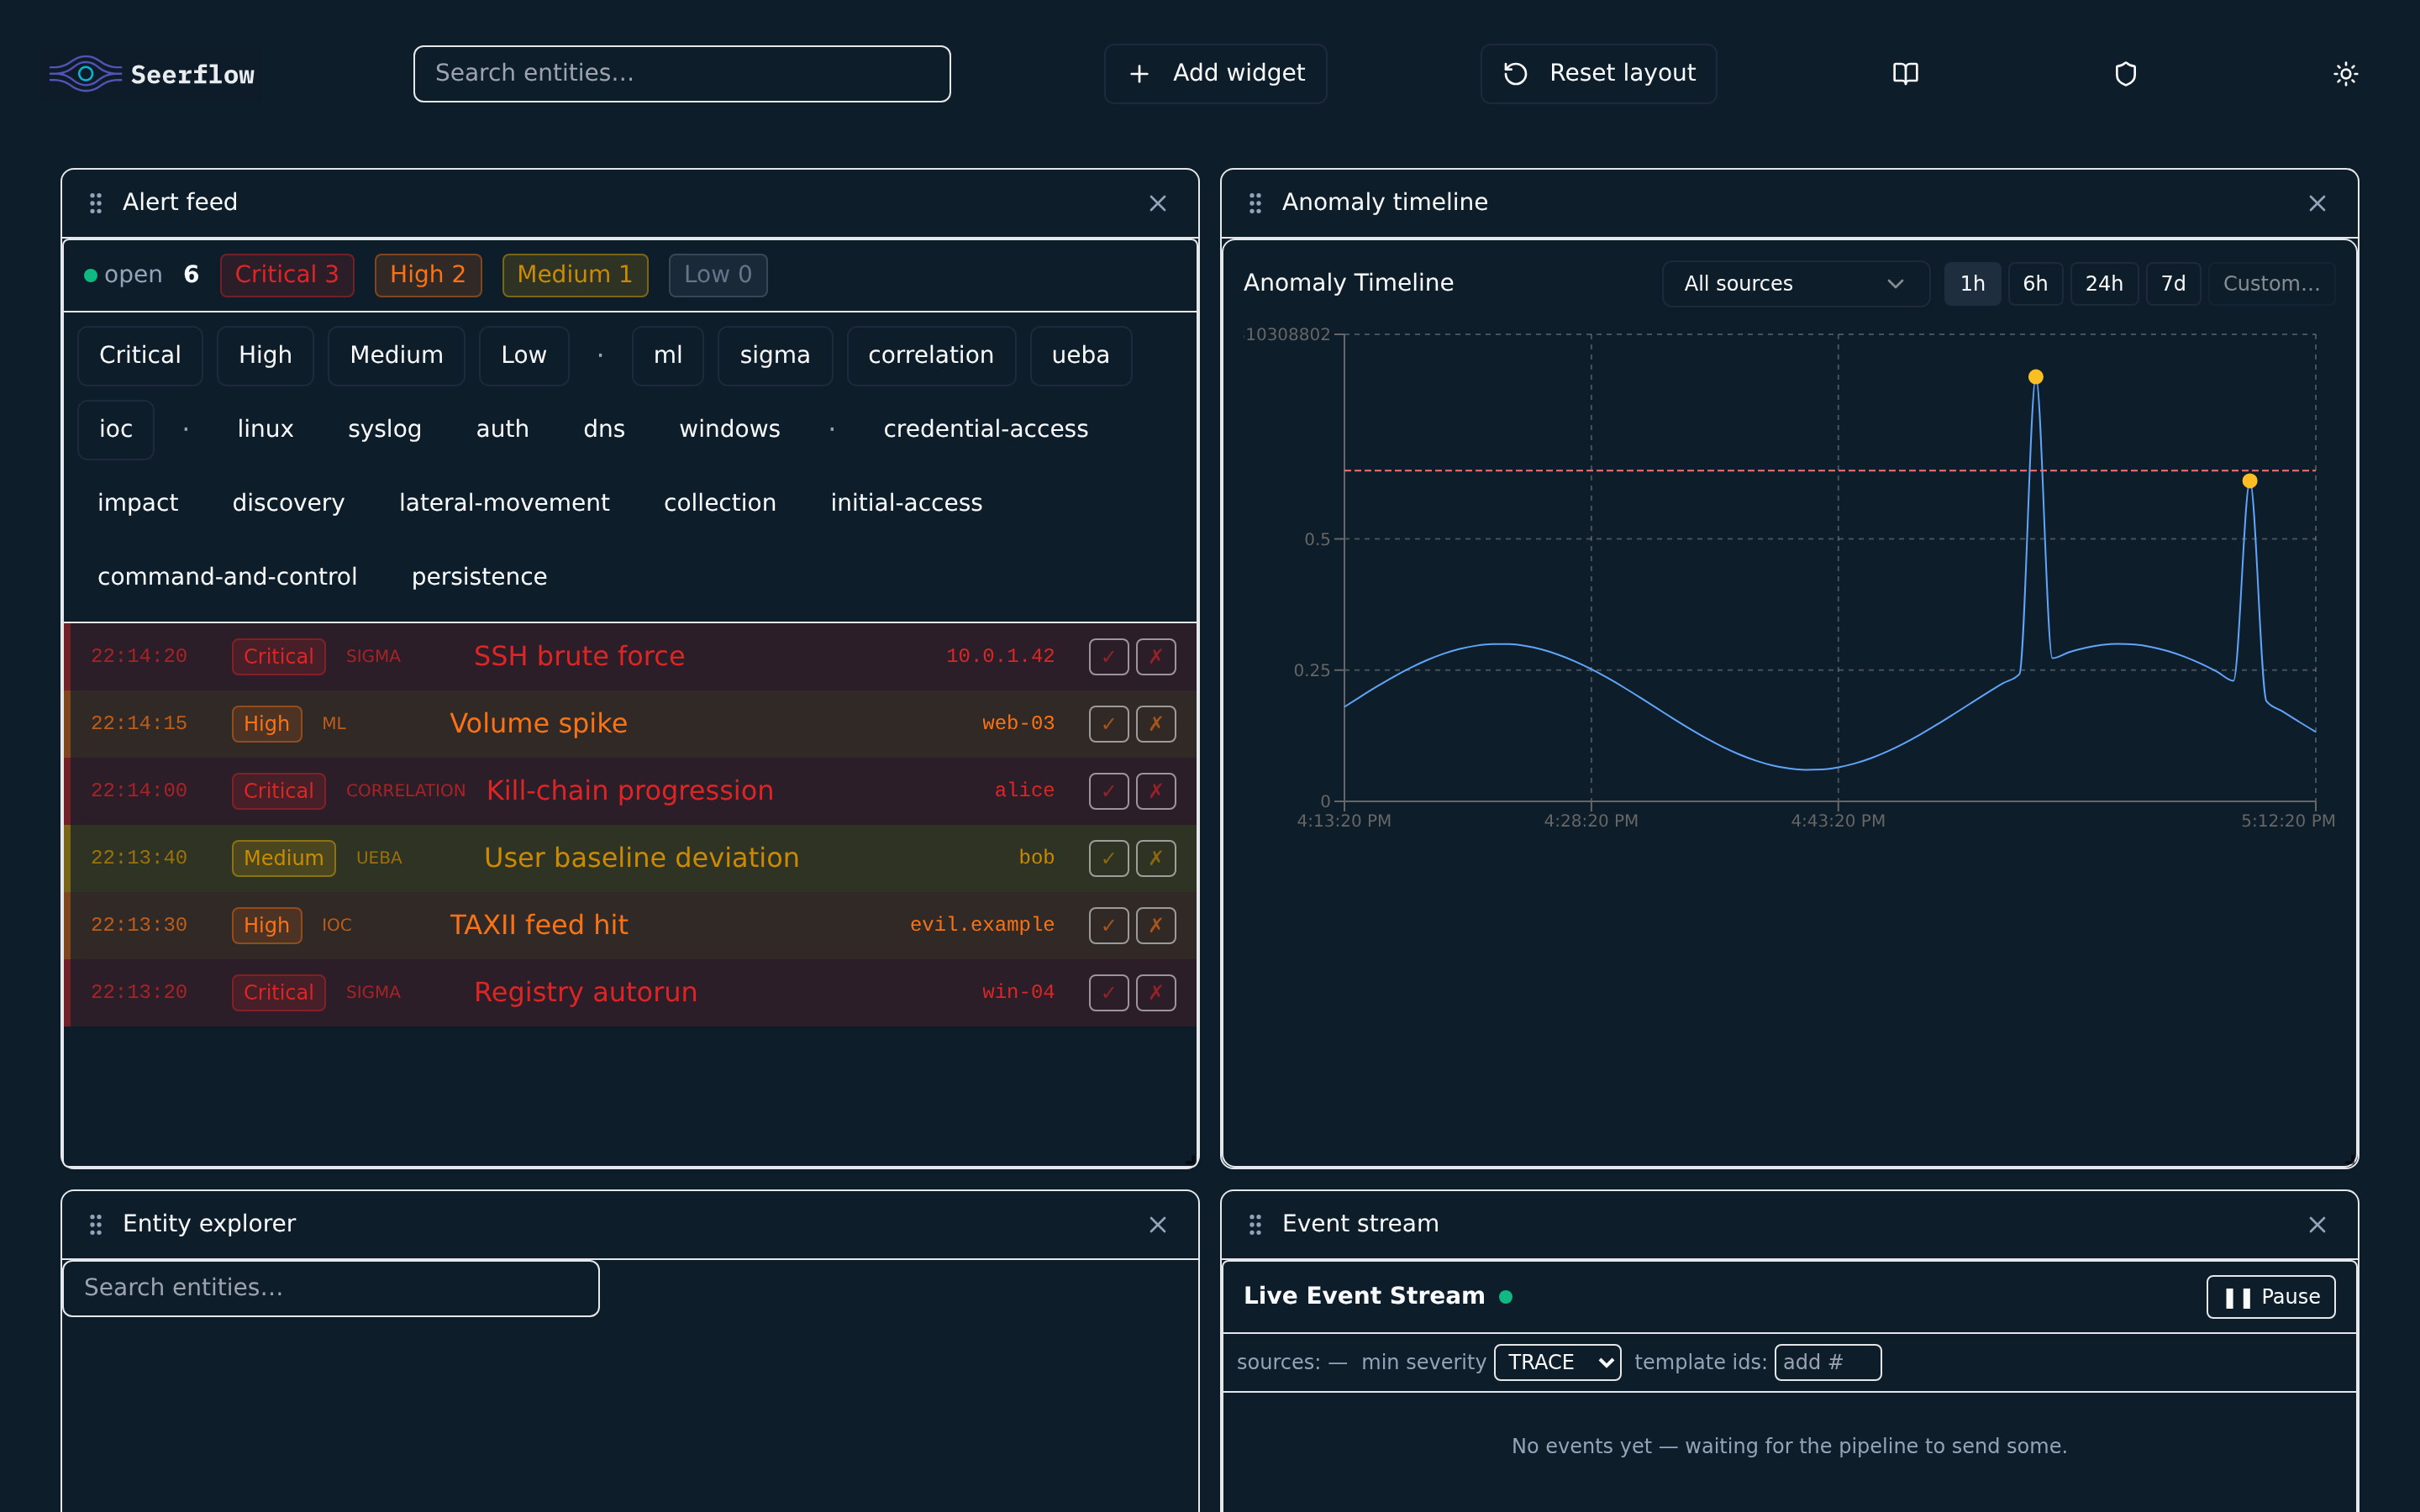
Alerts
Section titled “Alerts”The Alerts screen is a SOC-style triage console. A live alert feed combines the WebSocket alert stream with a GET /api/v1/alerts backfill, then adds status tabs, severity / type / source / tactic filter chips, a volume strip, and an 8-column triage table. Selecting an alert opens its detail view with contributing events and MITRE context.
Events
Section titled “Events”The Events screen pairs a live raw event stream (left) with a per-event inspector (right). A client-side query language filters the stream by field, template, entity, or free text.
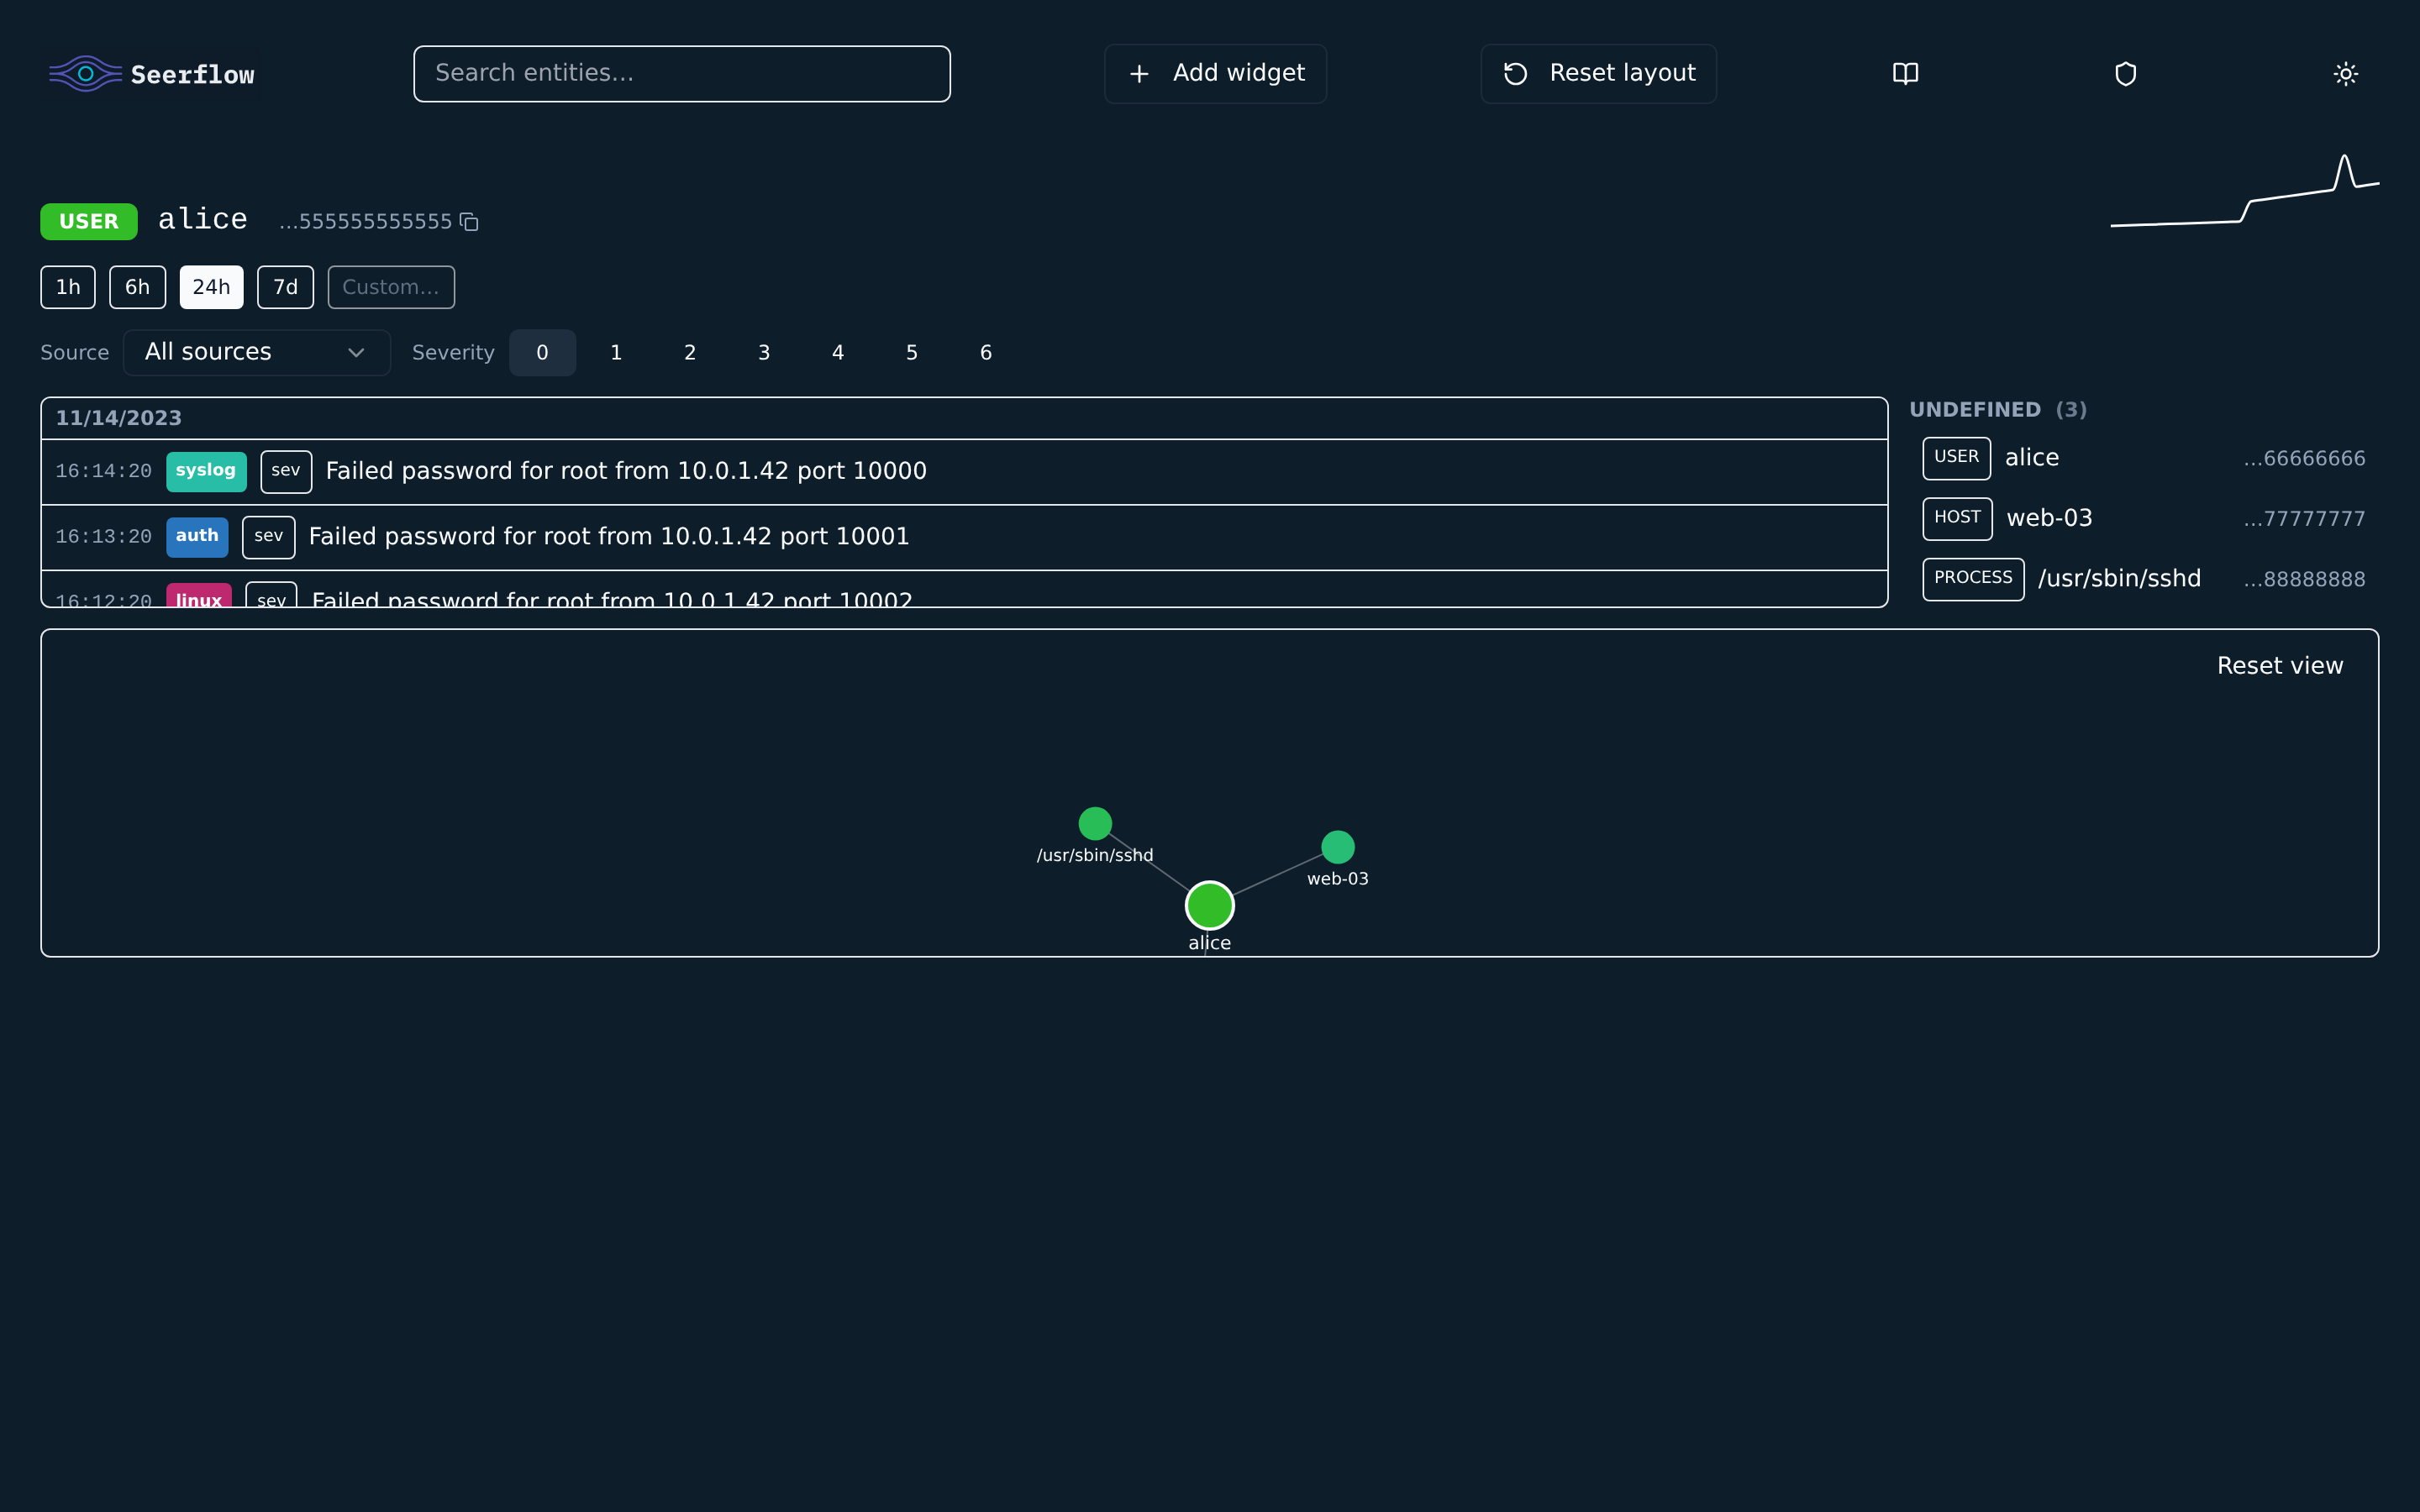
Entities
Section titled “Entities”The Entities screen is an interactive entity graph (Cytoscape). Selecting an entity — from search, an alert, or another node — centres it as the focal node with its related neighbours (users, hosts, IPs, services, processes) drawn around it.
- Filter by entity type, minimum risk, and time window (15m / 1h / 24h / 7d)
- Switch layout between force, radial, and hierarchy
- The right-hand inspector shows the focal entity’s risk, event/neighbour/alert counts, linked alerts, and a recent-event timeline
Entity selection is reflected in the URL hash, so links can be shared.
ATT&CK Coverage
Section titled “ATT&CK Coverage”The ATT&CK screen is the MITRE ATT&CK heatmap — every Sigma rule contributes to one or more (tactic, technique) cells across the canonical 14-tactic grid. Detected techniques are highlighted; hovering a cell lists the rules. Useful for spotting blind spots before a hunt.
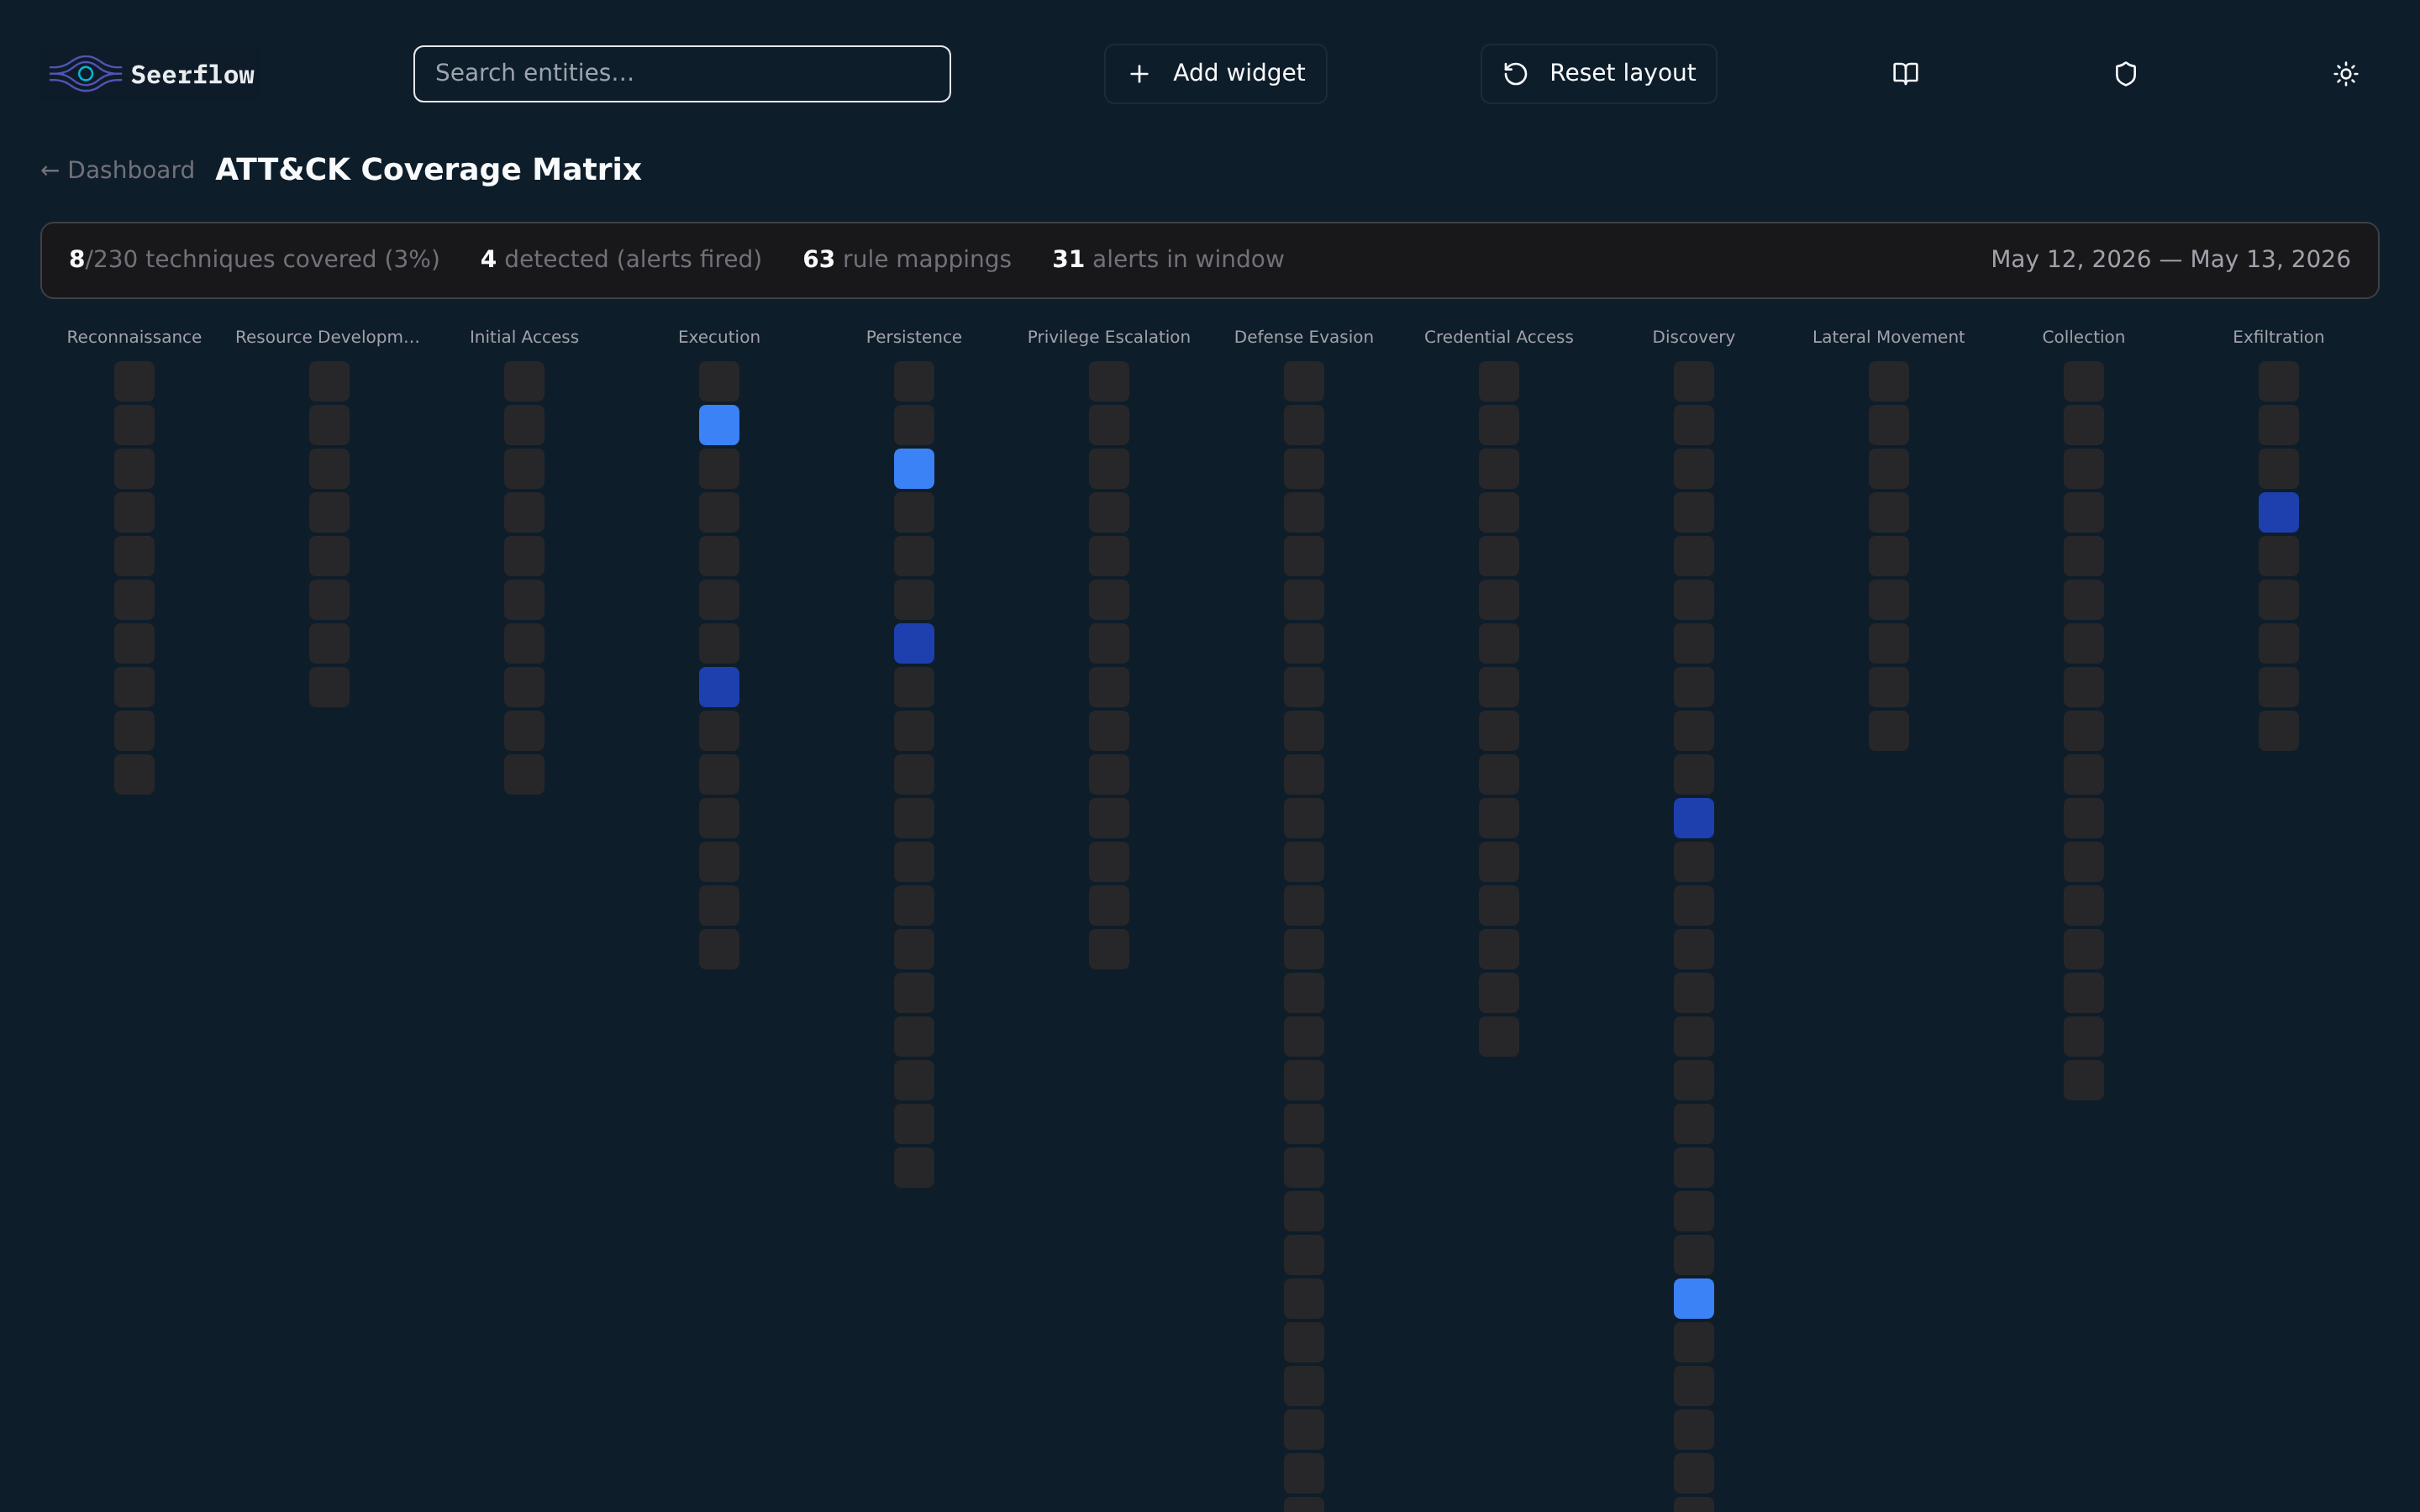
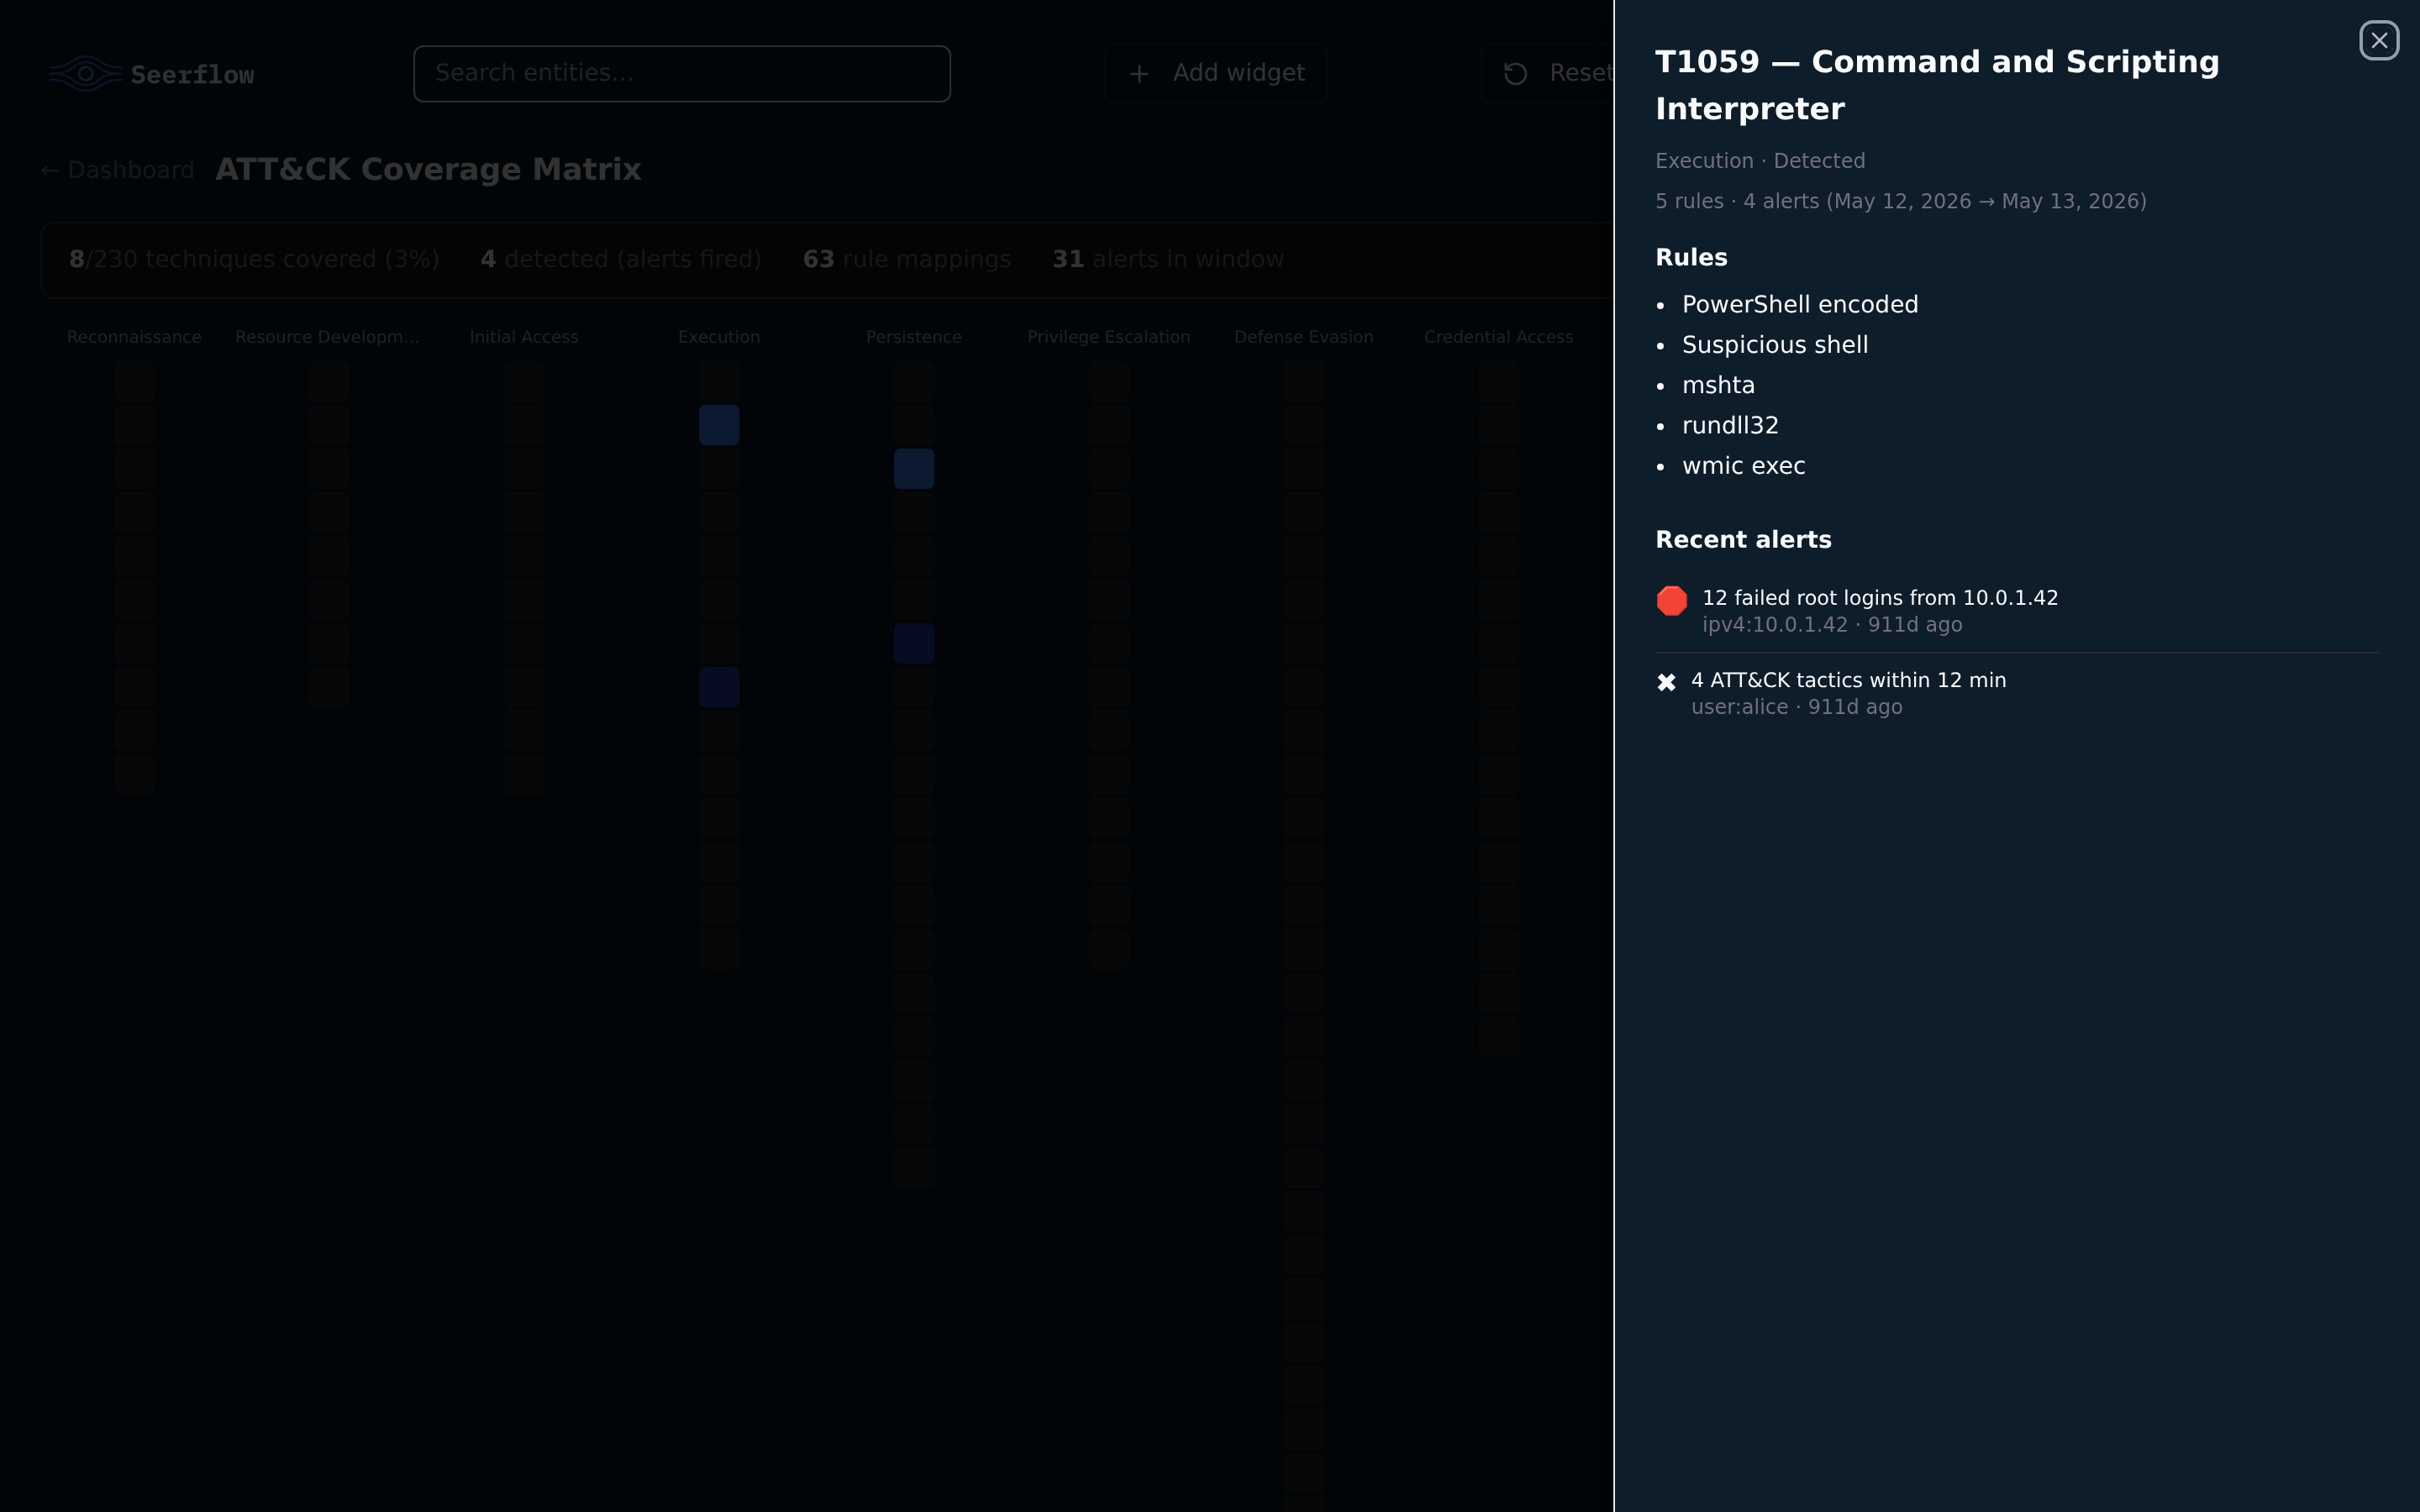
Click any covered cell to drill in — the panel shows the rules contributing to the technique and recent alerts in the window:
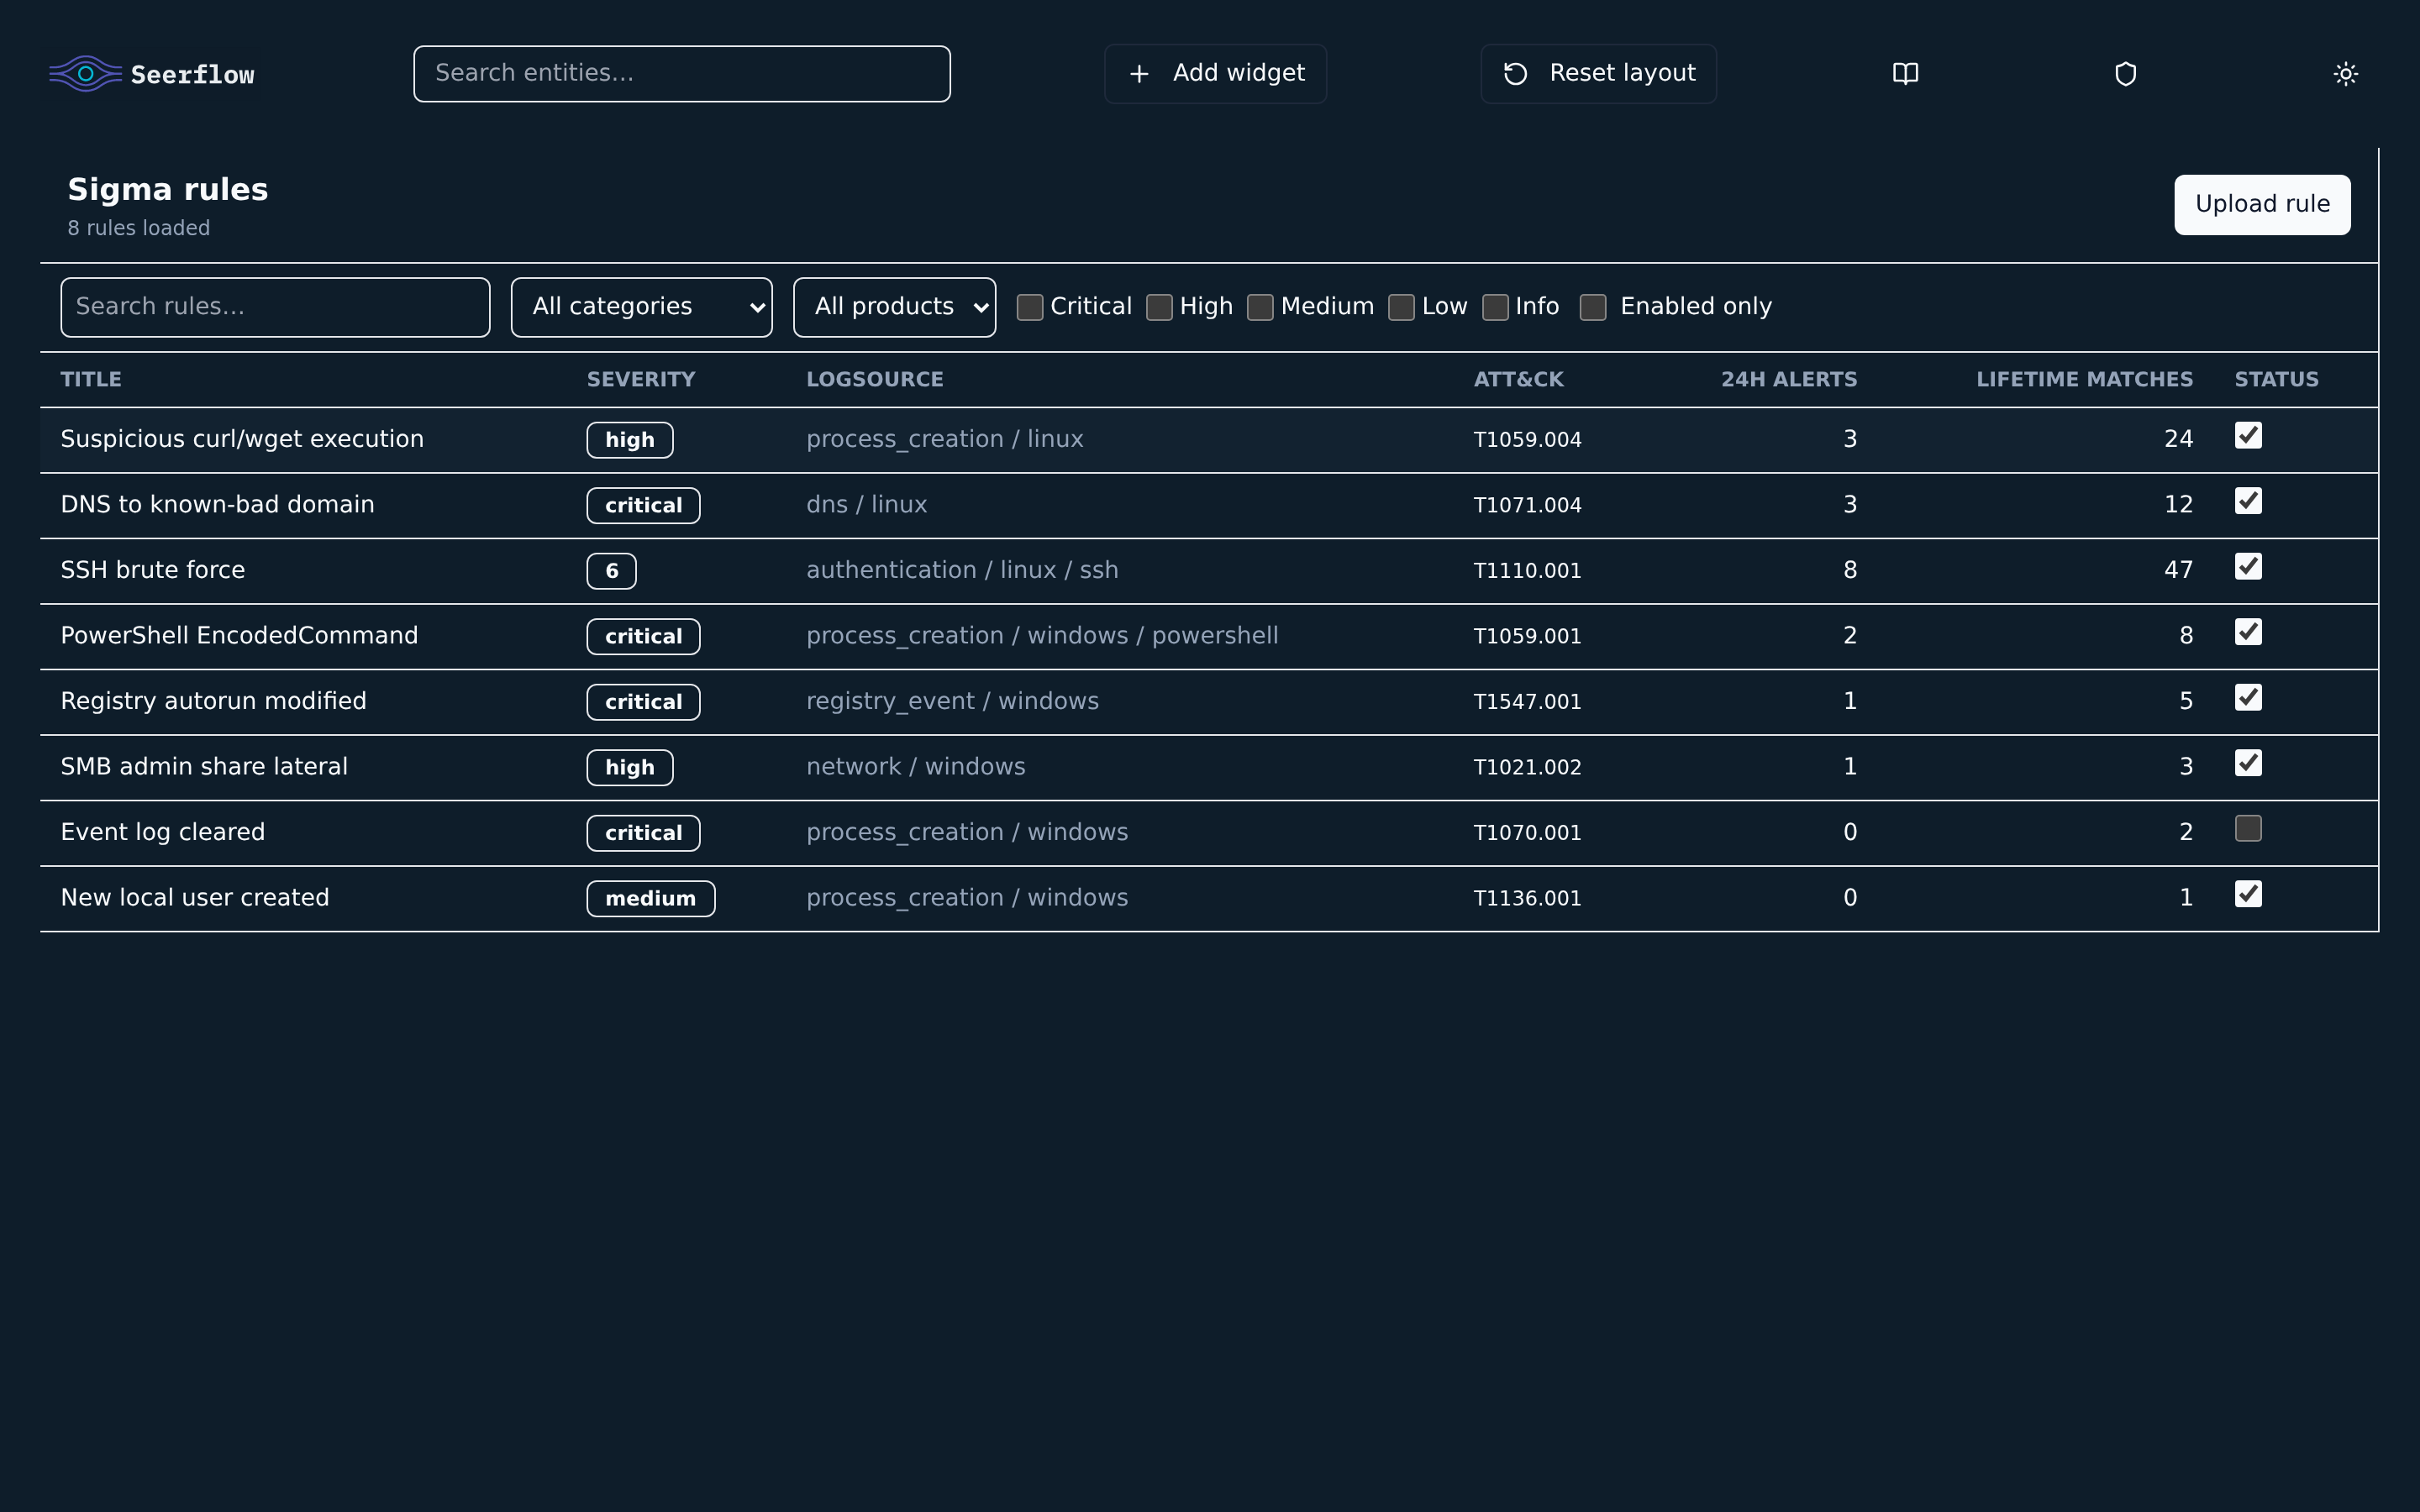
Sigma Rules
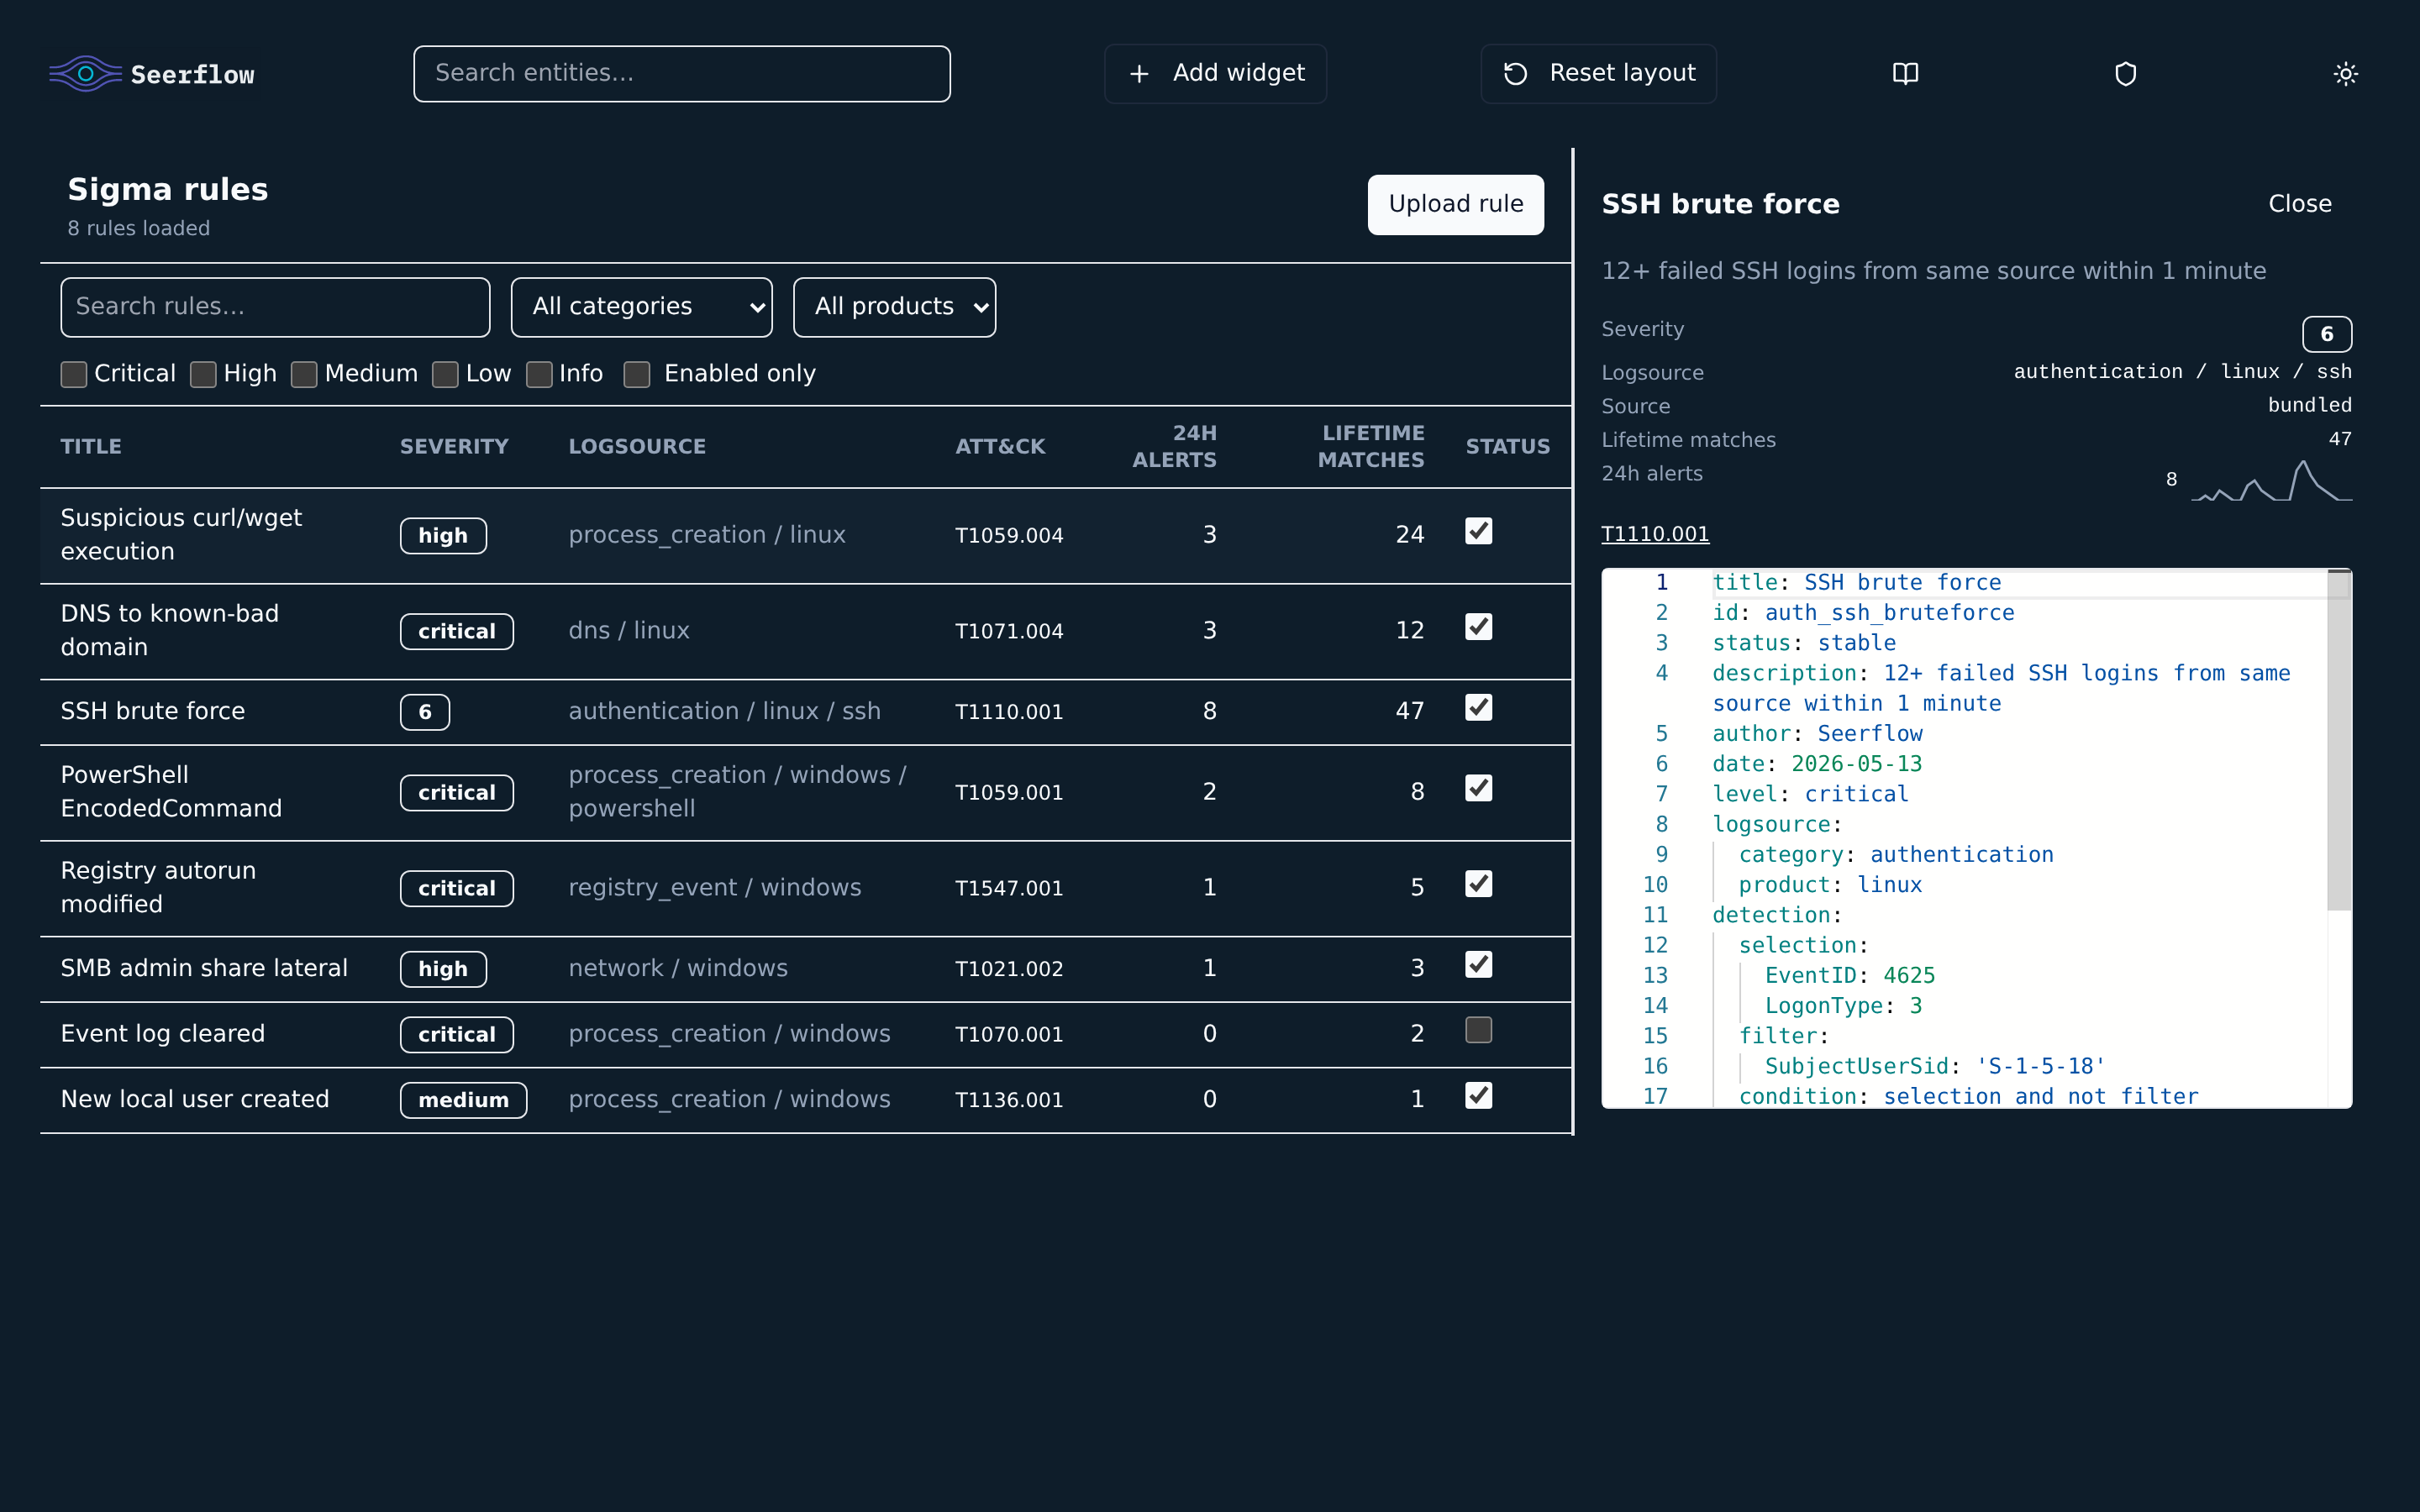
Section titled “Sigma Rules”The Sigma rules screen lists every rule loaded by the engine — bundled SigmaHQ rules plus any custom directories from detection.sigma_rules_dirs. Filter by status, precision, or free text; toggle a rule on/off (changes are persisted).
Click any row to open the detail panel — full YAML in a Monaco editor, a 24-hour fire sparkline, severity, logsource, and ATT&CK tags side-by-side:
URL Hash Routing
Section titled “URL Hash Routing”The dashboard uses URL hash fragments for shareable views — no server-side routing:
| Hash | View |
|---|---|
#/overview (or empty) | Overview |
#/alerts, #/alerts/<id> | Alert feed / alert detail |
#/events | Event stream |
#/entities, #/entities/<uuid> | Entity graph / focal entity |
#/attack | ATT&CK heatmap |
#/sigma, #/sigma/<id> | Sigma rules / rule detail |
Legacy deep links (#coverage, #sigma-rules, #entity=<uuid>) are still accepted and normalised to the new format.
Theming
Section titled “Theming”Light and dark themes are both first-class. Toggle from the top bar. The choice is stored in localStorage so it survives reload.
Production Notes
Section titled “Production Notes”- The dashboard wheel ships pre-built; no Node toolchain is needed at runtime.
- Static assets are served by FastAPI from inside the wheel — there is no separate web server to manage.
- For a hardened deployment, put nginx or a cloud LB in front and bind
dashboard_portto a private address; expose only that LB. - For container runs, override
health_bind_address: 0.0.0.0so the health probe is reachable by orchestrators.